
Providing Services Since 1983
Hazardous Waste Management Market - Scope of Database and Mapping Services
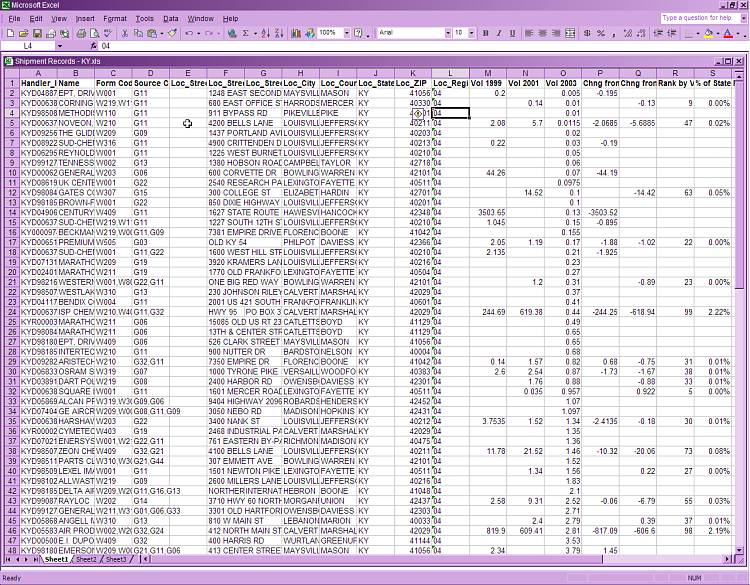
Quantity of Hazardous Waste - In each biennial year, hazardous waste shipments have been required to be reported by large quantity generators. The hazardous waste shipment data provided in these reports contains information on the location of the source of hazardous waste, of the quantity and types of hazardous waste shipped for management.
Click images for larger view.
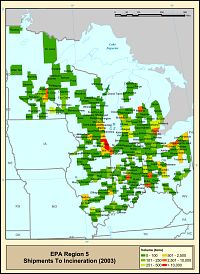
Management of Hazardous Waste – The biennial reporting data also included a disclosure of the type of management for the hazardous waste. The hazardous waste shipment reporting can therefore also be used to determine the amount of hazardous waste sent for specific management from any geographical region within the United States and/or biennial changes in quantities of waste shipped from the selected geographical. The types of waste management that are most suitable for this analysis are boiler and industrial furnaces (“BIF”) (waste to energy), fuel blending, incineration, landfills, solvent recovery, and stabilization.
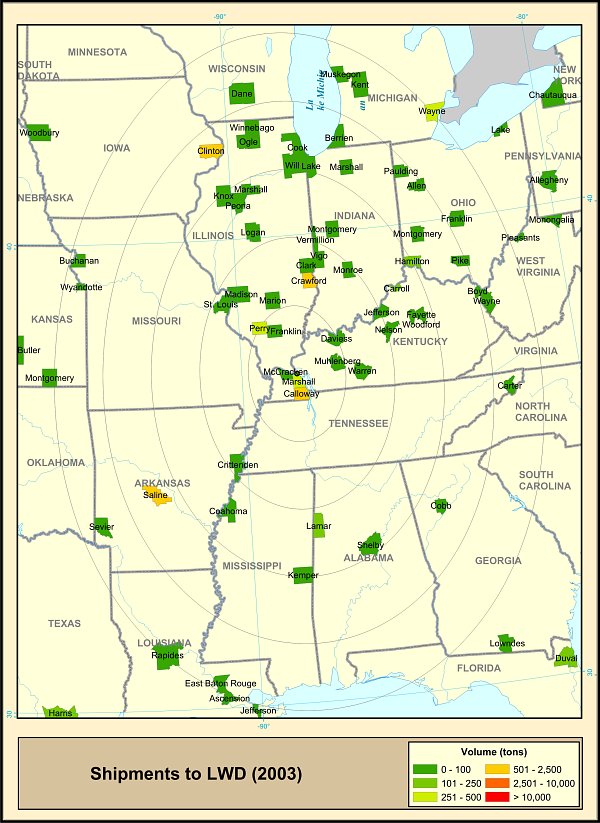
Market Share by Specific Facility – The biennial reporting identifies shipment to individual facilities by individual customers. These individual shipment records can be compiled to determine the amount of waste received at any given facility from a specified geographical regional market. As indicated earlier, this analysis can be further targeted on specific types of hazardous waste and/or waste shipped for a specific type of management. Trends in market share can be analyzed using multiple reporting years. Mapping of the individual sources is an important visual tool since distance from the facility and therefore the cost of transportation is a significant factor in customer choices in some markets.
Market Share within a Target Market – As described above in Market Share by a Specific Facility, it is possible for The Envirobiz Group Inc. to compile individual shipments within a geographical market. These compilations can be done for multiple facilities serving a target market to determine relative market shares. Mapping of the location of sources of shipments to various facilities provided a visual information tool essential in geographical areas where long distance transportation is key part of hazardous waste management costs.
For further Information about our hazardous waste market data – Please contact us by calling 858-695-0050 or email us at marketstudy@envirobiz.com