
Providing Services Since 1983

The Chartwell Solid Waste Digest is widely recognized as “the original source” on gate rates trends for both municipal solid waste and construction and demolition wastes. In 2010, the Chartwell Solid Waste Digest is offering individual state reports on municipal solid waste gate trends for the period of 2001 through 2009. These innovative, new reports provide decision makers with both an understanding of both recent and long term gate rate changes.
These individual reports represent the accumulation of nine years of research surveys. Each state’s report is available for $250.00. For information on multiple copy discounts, contact customer services. Show below is an example of a Municipal Solid Waste Gate Rate Trend Report for 2001 – 2009. Asterisks have been used to replace confidential proprietary statistics in the report.
Municipal Solid Waste Gate Rate Trend 2001 - 2009
This confidential consulting report is copyrighted and all rights are reserved. All data and findings in this report are the exclusive property of The Envirobiz Group, ISSN 1069-501X.
Contact Information
For further information on purchasing reports, contact customer service at:
7515 Wayzata Blvd. Ste. 135
St. Louis Park, MN 55426
Phone: (952) 831-2473
Fax: (952) 831-6550
For customers needing to discuss this report with the Envirobiz Group’s researchers, please call:
Mr. Cary Perket, President
The Envirobiz Group, Inc.
Phone: (858) 695-0050
Fax: (858) 695-0250
By Cary Perket
For the entire period of 2001 through 2009, the state average and median gate rates in Arizona were lower than the corresponding national average and median gate rates. In 2009, the state average gate rate at $*/ton was $* per ton lower than the national average; the state median gate rate was about $* per ton lower at $* per ton. However, there is a significant difference in average and median gate rates as well as gate rate trends between small, medium, and large landfills.
The state average gate rate was $* per ton in 2009. The 2009 average state gate rate are about the same as the previous year. The triangular points in Figure 1 represent the state average gate rates during the period of 2001 through 2009. During that period, the state average gate rate increased by $* per ton. The national average gate rate (represented by the circular points and trend line) increased by $* per ton over the same period to $* per ton.
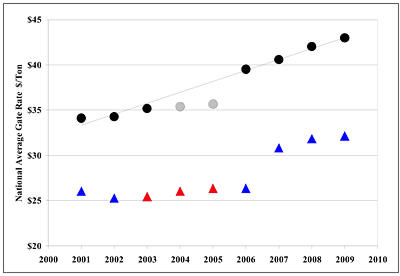
Figure 1
State vs. National Average Gate Rate
Municipal Solid Waste
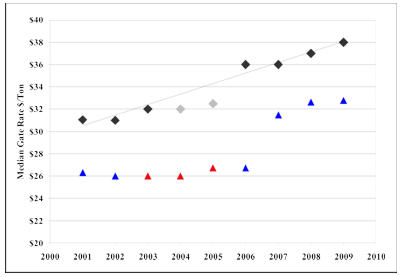
Figure 2
State vs. National Median Gate Rate
Municipal Solid Waste
Arizona’s large and medium landfills had statewide average and median gate rates that were less than the corresponding national average and median gate rate in 2009. In 2009, Arizona’s small landfill average state rate was the same as the nation average gate rate. Since the Arizona average and median gate rates in 2001 were less than corresponding national average and median gate rates for different sized landfills, the current gate rates represent a percentage change in gate rates faster than the national change for large and small landfills.
The large landfills were found in the survey to have an average gate rate of slightly below $* per ton. The change in gate rate between 2009 and 2008 was less than a $* per ton. The median state gate rate for large landfills was determined to be about $* per ton; the small amount of change between 2008 and 2009 was insufficient to change the state’s median gate rate at large landfills. Since 2001, the median at the gate rate changed by $* per ton at the state large landfills. Comparatively:
- Nationwide, large landfills had an average gate rate of $* per ton, slightly below the gate rate at this landfill.
- Nationwide, the average gate rate at large landfills has risen approximately $* per ton since 2001
- The national median gate rate for large landfills was $* per ton,
- Nationwide, the median gate rate at large landfills has raised approximately $* per ton since 2001.
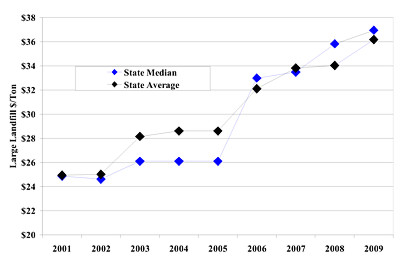
Figure 3
Large Landfills
- Nationwide, the medium landfills had an average gate rate of $* per ton in 2009.
- The change in the national average gate rate for medium landfills since 2001 was $* per ton
- Medium landfill, in 2009, had a nationwide median gate rate of $* per ton
- Since 2001, the national median gate rate for medium landfills increased by $* per ton
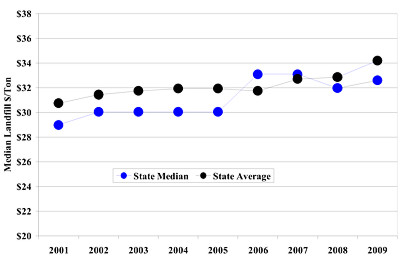
Figure 4
Median Landfills
- Small landfills had a nationwide average gate rate of $* per ton
- The national average gate rate for small landfills increase by $* from 2001
- The nationwide median gate rate for small landfills was $* per ton
- The national median gate rate for small landfills since 2001 rose by $* per ton
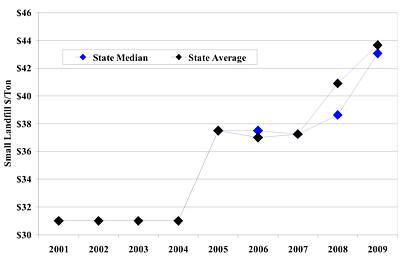
Figure 5
Small Landfills
The average state gate rate is highest at small landfills ($*/ton); large landfills have a higher average state gate rate ($*/ton) than the medium landfills ($*/ton). The median state gate rates, high to low, are $*/ton at small landfills, $*/ton at large landfills, and $*/ton at medium landfills.
The rate of increase in state’s gate rate, as measured by the percentage increase since 2001, is faster than the national change for large and small landfills since 2001. The change in the average and median state gate rate for medium landfills is less than the occurring on a nationwide basis for the same size landfills.